Saturday, January 27, 2007

The sensitivity of industries to labour regulations

Don Boudreaux over at Café Hayek pointed to an article by Gary Becker and Richard Posner ($) published in yesterday’s Wall Street Journal. Here’s an excerpt:

An increase in the minimum wage raises the costs of fast foods and other goods produced with large inputs of unskilled labor. Producers adjust both by substituting capital inputs and/or high-skilled labor for minimum-wage workers and, because the substitutes are more costly (otherwise the substitutions would have been made already), by raising prices. The higher prices reduce the producers' output and thus their demand for labor. The adjustments to the hike in the minimum wage are inefficient because they are motivated not by a higher real cost of low-skilled labor but by a government-mandated increase in the price of that labor. That increase has the same misallocative effect as monopoly pricing.
Surely, just like the minimum wage, other regulations on labour also have a greater impact on certain industries relative to others. I started thinking about this when another commentator asked why the U.S. doesn’t adopt a 35-hour work week. Here’s most of what I posted in response on Café Hayek:

….regulations on hours worked can be just as painful to certain sectors as minimum wage requirements. First, it does seem odd that 40 hours is considered to be a "natural" and permanent level (although, I think the French have already proven what a failure the 35-hour week can be). Second, I can’t understand how an obligatory set of hours can be optimal for ALL industry sectors. Perhaps regulations on hours of work distorts the ability of each sector to find its own "natural" level through heuristic means, or whatever, thus hampering productivity and efficiency in certain sectors. I’ll explain.

Any strict regulation on hours worked, be it 40 hours or whatever, may not work for all sectors for at least two reasons: i) some sectors are productive in spurts (I’m reminded of a post on freexchange where a reader notes that "anyone building a house or undertaking a project that requires a number of diversified tasks comes up against the brick wall of inefficiency" when faced with regulations on hours worked); and ii) not all sectors have the same firm-size make-up. An IMF report shows that moving from a 40-hour to a 35-hour work week encouraged French workers in "large firms to take second jobs or to move to small firms where the 35-hour work week is not obligatory." In other words, while a 35-hour work week might be optimal for sectors comprised of small firms, it is likely not optimal for larger corporations, the backbone of our economy.

Another reader points out something that I didn’t add, but I should have:

I agree that it should be up to the company how many hours one should work - up to some maximum allowed under law under at-will labor. I mean, as long as you know the terms before you agree to the work, companies should have a lot of flexibility.

I just wanted to take note of the subject of work hour regulations here because I thought it might be interesting to sometime explore its impact on various industry sectors. Perhaps some industries have more to gain from a barrier-free labour market than others. Further, perhaps the existence of certain regulations on labour distorts the "natural" sectoral make-up of a nation's economy.

Thursday, January 25, 2007

How the east contributes to wealth inequality

A fire might have been ignited under western Canada when policy makers implemented a business friendly tax structure, but positive investor sentiment is going to take it from campfire to bonfire before the rest of Canada (hereafter, TROC) even gets its matches out of the box. The combination of two recently released reports makes me believe this.
First, The Fraser Institute released its Canadian Provincial Investment Climate Report: 2007 Edition. In it, they publish something called the The Provincial Investment Climate Index, which has seven components: 1. Corporate income tax (CIT), 2. Fiscal prudence, 3. Personal income tax (PIT), 4. Transportation infrastructure, 5. Corporate capital tax (CCT), 6. Labour market regulation, and 7. Burden of regulation

Here’s an abstract from a press release:

The Provincial Investment Climate Index objectively evaluates the public policies that create and sustain a positive investment climate. It ranks each province on a scale of one to 10.

Alberta earned the highest score, 8.9 out of 10, and was clearly Canada's top province for policies that encourage and sustain a positive investment climate. BC followed in second position but some distance behind with a score of 6.0 out of 10. Saskatchewan is third with a score of 5.3 out of 10. The three western provinces were the only ones with an overall score above 5.0.

Ontario was fourth overall with a score of 5.0 while Quebec, with a score of 3.0, was ninth.


Jason Clemens, a co-author of the report, had this to say:

The low scores for Quebec and Ontario are among the most worrying aspects of this year's report. These two provinces are extremely important to the Canadian economy, yet they have chosen to implement policies that are not conducive to attracting investment.

As the west becomes more business friendly, wealth tends to blow that way. But then there's a multiplier effect that kicks in when wealthy westerners begin investing to a degree that surpasses that of individuals elsewhere across Canada.
Earlier this month TD Waterhouse released a report which claims that “…those living in the west are more aggressive investors with higher expectations and greater use of financial plans and advice than those living in Quebec and Atlantic Canada. Ontarian investors, in accordance with their geography, are somewhat in the middle.”


I would attempt to explain this two ways: i) as individuals in the west become more wealthy and more experienced in investing they become less risk averse in their investment strategies; and, ii) we’re seeing that individuals who have a higher propensity to invest also have it in their interest to move, or remain, where the business climate is most attractive: in the west (whether for wage or salary prospects, or for entrepreneurial incentives).
But studies in behavioural economics suggests that there's more here than simply the fact that wealthy westerners will be getting wealthier by putting their money to work. Westerners will also gain experience ahead of TROC. I'm reminded of a paper by Daniel Kahneman where he explains that experienced traders show less reluctance to trade, almost as if they learn to "base their choice on long-term value, rather than on the immediate emotions associated with getting or giving up options." The parallel to the west seems convincing.
Further, while propensity to invest is rocketing in western Canada, it's also the case that in TROC, it's really, really, not. The TD Waterhouse report tells us that “the most favoured type of investment in Quebec is savings held in a savings account (55%).” Talk about low expectations.
The bottom line is that the longer it takes TROC to become business-friendly (or ditch the welfare state sentiment, in the case of some regions), the greater the division of wealth will be across Canada. This will hurt TROC for obvious reasons, and it’ll hurt westerners who will be pressured into being good sports and promoting equality through transfer payments.
Addendum: Damn-it. My images always come out as good as dirt. I vow to work on that at some point.

Sunday, January 21, 2007

Look at me, I read The Economist

I must be in a strange mood, because I nearly busted a rib laughing at this Onion piece. And yet,... should I have?

h/t The Healthcare Economist

Wednesday, January 17, 2007

The influence of values vs. remittance

From "Migrant Power," The Economist, Jan. 16

As migration changes, shorter-term movements will bring migrants home with wealth accumulated abroad and human capital in the form of knowledge and new institutional norms that can improve domestic life. The American experience suggests that, for all the fears that Mexican culture is overwhelming the domestic variety, the influence is more likely to go the other way. Tyler Cowen, an economist who does field work in Mexico, points out that American influences—whether consumer tastes, a greater inclination to give to charity or more enthusiasm for democracy—are stronger there than anywhere else in Latin America. The spread of values, in other words, may be just as influential as the remittance of cash.

Emphasis is my own. This is an interesting way to look at temporary labourers. I've never perceived them as being potential ambassadors of American goods and values.
FYI: did you know that if you use an RSS to access The Economist, you're a click away from free content -- including the premium content that isn't accessible to non-subscribers on the magazine's Web page? Perhaps this is a temporary glitch.

Sunday, January 14, 2007

M&M's -- No!

What if you could auction off a logo at Christie's or Sotheby's (nyse: BID - news - people ) to determine the notoriously tough-to-measure market value of a brand?One prism through which to measure the perceived value of global brands is the contemporary art world, and in particular the sale prices of the works of Wang Guangyi, one of the leading lights of the post-1989 Political Pop Art movement in China ... Wang is the Andy Warhol of the Chinese art scene--at once criticizing commercialism and profiting by including famous brand names in his works.

The rest of the article can be found here.


My favourite Wang (only because I prefer Reese's):


M&M's ("The Great Criticism" series: M&M'S)
Oil on canvas, 1993, Sale price: $180,000 Estimate: $150,000-$180,000, Sotheby's New YorkSale: Contemporary Asian Art, Sept. 20, 2006

Big-box stores, food prices & the CPI

Abstract from The Impact of Big-Box Stores on Retail Food Prices and the Consumer Price Index, by Ephraim Leibtag (Economic Research Report No. (ERR-33) 41 pp, December 2006)

This report focuses on retail food market dynamics and how they affect food price variation across store formats. The differences in prices across store formats are especially noteworthy when compared with standard measures of food price inflation over time. Over the past 20 years, annual food price changes, as measured by the CPI, have averaged just 3 percent per year, while food prices for similar products can vary by more than 10 percent across store formats at any one point in time. Since the current CPI for food does not fully take into account the lower price option of nontraditional retailers, a gap exists between price changes as measured using scanner data versus the CPI estimate, even for the relatively low food inflation period of 1998-2003. This study estimates that the CPI for dairy products overstates food price change by 0.5 to 2.5 percentage points per year for dairy, eggs, and butter/margarine.

Saturday, January 13, 2007

'Stock Markets Contract as M&A Overtakes Equity Sales'

While the contraction of the stock market due to mergers and acquisitions (M&A) isn’t an entirely new phenomenon, it’ll be interesting to see how Canada, the U.S. and Europe are individually affected in '07 by further M&A. The Bloomberg article I excerpt from below doesn’t mention Canada in specific, but I imagine that M&A will have a greater impact on Canadian investors relative to U.S. investors, as Canadian markets are smaller. This article suggests that companies could end up paying too much as the M&A "fad" jacks up prices.
To put things in context, the value of Canadian M&A deals doubled in 2006 to US$173.6 billion (the number of deals increased by 26%) and European country deals went from US$244 to US$266, while US deals went from US$229 to US$266 billion (Japan actually dropped).

Bloomberg, by Michael Tsang and Daniel Hauck (Jan 8) (Full article here)

Stock markets are shrinking as mergers and acquisitions take shares out of public hands faster than companies add them through equity sales. The value of U.S. shares dropped last year by the most since 1984 and the European market narrowed for the first time, according to Citigroup Inc. Last year's $3.68 trillion in takeovers, led by AT&T Inc.'s $86 billion purchase of BellSouth Corp., outweighed the biggest year for initial public offerings since at least 1999.

The contraction may continue in 2007 as dealmaking accelerates. M&A will rise by at least 10 percent this year, analysts at Deutsche Bank AG, JPMorgan Chase & Co. and Bank of America Corp. forecast. Private-equity investors alone have $1.6 trillion to spend, Morgan Stanley estimates.

"Corporations and the private-equity crowd both appear to still be on a buying spree," said Eric Bjorgen at Leuthold Weeden Capital Management in Minneapolis, which oversees $2.8 billion. "Less supply implies higher prices. That's bullish."
The reductions helped lift the Standard and Poor's 500 Index and the Dow Jones Stoxx 600 Index in Europe to the highest in six years. Stock buybacks also climbed to an all-time high. Last week, the S&P 500 fell 0.6 percent to 1409.71 and the Stoxx 600 gained 0.1 percent to 365.69.

Buyout funds and companies may wind up paying too much as they vie over acquisitions. It may "end badly" for stock investors later this year, said Jason Trennert, chief investment strategist at Strategas Research Partners LLC in New York.

Top Priority

"Given the sheer amount of money that's been raised, it seems to me that there's a chance that this could be taken to an extreme," he said. "Fads tend to take on a life of their own."

Tuesday, January 09, 2007

The underground economy and the poor

Neil Reynolds takes a look at the role that the poor play in the hidden economy.

The Globe and Mail (Jan. 5) ($):


How do poor families spend so much more money than they earn? By one measure — the National Council of Welfare — the average poor Canadian family spends $4,855 a year more than the $14,366 it receives as income, a difference of 33 per cent. By another measure — the Fraser Institute — the average poor Canadian family spends $9,370 more than the $9,114 it receives as income, a difference of more than 100 per cent.

* * * * * *

How does Statscan determine the income of the poor? It asks them. How does it determine the spending of the poor? It asks them. What's the source of the "bonus bucks" that the poor spend? Perhaps, in one of its surveys, Statscan should ask them. We can, meantime, only speculate.

Off-the-table earnings. Wanton use of credit cards. Gifts from more affluent family members. Academic scholarships. (Many postgraduate students are, by LICO logic, poverty-stricken.) But Canada's basic information on poverty remains dubious.

No one knows whether the poor, in their reports, minimize the money they either earn or otherwise get. It shouldn't be surprising if they do. Everyone else does it all the time.


I want to make two points. First, nobody is implying that the underground economy is strictly measuring income concealment, as some detractors seem to be charging. In a 1992 report published by Statistics Canada, "the underground economy" is defined as the mean economic activity that is not measured in the system of national accounts. In the past I may have failed to mention other sources of the "hidden economy" when referring to income concealment, but that’s because I was being sloppy and perhaps aiming for brevity.
Secondly I’ve read quite a few papers recently about different approaches to income concealment (ie. ignoring the rest of the hidden economy). The expenditure approach, developed by Pissarides and Weber (1989), seems to be the most well-received, at least according to the literature that I’ve read (please share your opinion here if you have one!). For example, Pissarides and Weber look at the relationship between income and food expenditures for salary and wage earners to evaluate the "normal" relationship between the two. They then compare this relationship to the income/food expenditure relationship of the self employed. If food expenditure appears to be incredibly high relative to the income level for the self employed, involvement in the hidden economy is assumed.
A major assumption is that the wage and salary earners (in comparison to the self employed) have very little ability to conceal their income (again, never mind their total involvement in the hidden economy), because employers document employees' earnings on their T4 slips. Thus, data from wage and salary earners is assumed to be actual. In relation to Reynold's article, this implies that poor families spend more money than they earn not because they are concealing income, but because of credit, loans, etc.

I have some criticisms of the expenditure approach, only one of which is relevant to Reynold’s article. The expenditure approach often depends on the use of surveys, for lack of other data. But to what extent can we rely on surveys? I have in mind a paper by Elffers, Weigel and Hessing (1987), who found zero correlation between survey results and audits for Dutch taxpayers. If there is zero correlation, even for wage and salary earners (this surprises me), this is a violation of a key assumption of the Pissarides and Weber model.

Further to Elffers et al’s findings, Andrew Jackson at the RPE blog has this to say:
Statistics Canada’s main surveys of consumption patterns are not very reliable, particularly when it comes to measuring the consumption of the very poor. Household surveys (formerly the SCF and the SLID) have been shown by Statistics Canada to produce significantly lower estimates of the incidence of low income than Census and tax data, likely because of under-sampling at the low end of the income distribution. (See Marc Frenette, David Green and Garnett Picot "Rising Income Inequality in the 1990s" in David Green and Jon Kesselman (Eds) Dimensions of Inequality in Canada, UBC Press, 2006.)
While this is a major blow to the expenditure approach (and there are others I won’t bore you with), I have to agree with Mr. Reynolds: i) the data simply does not tell what is hidden; and, ii)if other wage and salary earners are in some way involved in the hidden economy, why assume that the poor are an exception? Jackson’s critical piece on Reynold’s article can be found here.
By the way, if it's ever the case that you're itching to read an available-by-subscription-only article that I refer to, I don't mind emailing it by request.

Sunday, January 07, 2007

Productivity and firm size in construction, pt2

A couple of posts back I asked why Canada’s construction sector is said to be more productive than the U.S. sector, despite having smaller establishment sizes. The gap isn’t huge, but it’s surprising. I don’t know if any single concept can answer this. Instead, I’ve broken it down to two questions: why are the Canadian firms small, and why are they more productive.

On being small…

Small establishments are unburdened from taxes on inventory
If one considers the high taxes that the construction sector faces on inventory, it seems reasonable that large companies wish to unburden themselves of this tax by contracting individuals to do certain services. Perhaps in Canada self employed contractors are more willing to take on the risk of being taxed on inventory (perhaps due to favourable tax scheme on Canada’s self employed, in comparison to the U.S.? I don’t know if this would justify the gap).


Variable taxes, in contrast to flat taxes, keep establishments small, even in Canada’s most populated areas where construction productivity is destined to be highest regardless of establishment size
B.C. has the lowest provincial tax rate in Canada up to a taxable income of $67,500 per annum. Above this income level, the rate rises rapidly and Alberta becomes the lowest personal tax jurisdiction at an income of $88,000 per annum. B.C. has the highest unincorporated self employment rate of all of Canada in the construction sector while Alberta has the highest incorporated self employment rate (see graphics below that I created using StatsCan CANSIM data Table282-0011). Perhaps Canadians are more sensitive to an un-level tax scheme than Americans.
Here's my colour scheme:
self employed unincorporated w/ no paid help,
self employed incorporated w/ paid help,
self employed incorporated w/ no paid help,
and the final pie in lime is self employed unincorporated with paid help.


On being more productive…

Economies of scale are relatively unimportant in the construction sector
Construction is highly labour-intensive, depends on a high proportion of low-skilled jobs and is not considered a high technology sector. Further, I would argue that where economies of scale do matter in the construction sector, they mean less than they once did. Thus, simply being big doesn’t give U.S. firms a greater advantage in this sector.


The hidden economy
If labour inputs are somehow being underestimated, then productivity (measured in my last post as GDP divided by hours worked, by the way) could be distorted.
For example, John O’Grady (2001) estimated that, on average, the annual underground income in Ontario’s construction industry, in the period 1998-2000 increased to $2.395 billion. This is due to the "hidden economy" composed of self-employed individuals who wish to conceal their income, which we know is easier to do in the construction sector than nearly any other sector.
Also, I think dachisb made a good point in response to my first post: "I would wager that low cost labour (read mexican migrants) drives most of this difference."
Not all construction is made equal
I’m not sure what affect this would have, but I thought it was worth noting that heavy and civil engineer construction is much smaller in Canada then, say, the construction of buildings. Surely many modes of construction have their own unique productivity level, and the compilation differs across countries.


Am I missing anything? Any more ideas anyone?

Friday, January 05, 2007

The rise of necessity entrepreneurs?

December saw 62,000 new jobs, taking the jobless rate to a 30-year low.

Ahem. Who was it that defied just about every analyst that said the labour market would fall in Q4? I believe it was me. But perhaps I was just lucky. Anyway, I didn’t see it all coming...
Self employment is booming. BMO economist Douglas Porter says December’s job gains were spread across all sectors, except construction was up only slightly. Is there any good reason why all these people with jobs wouldn’t pump up residential construction? Perhaps, if they didn’t have the right jobs. The Globe and Mail reported today that 49,000 of the positions were characterized as self employed.

This reminds me of a previous post where I explored three reasons why individuals might become self employed:
a) self employment is a stepping stone to other work
b) self employment is a stepping stone to retirement
c) self employment persists in periods of poor job growth
As hiring slows down, it might be the case that a) and c) are coming true. Perhaps self employment really is an innate survival skill. I’ll return to this topic at some point.
Also, I haven’t forgotten about my last post on the construction sector. I’ll continue with that tomorrow. Or something.

Thursday, January 04, 2007

Productivity and firm size in construction

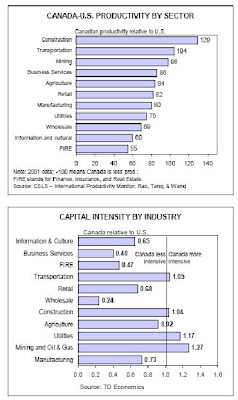
Why would Canada's construction sector be more productive than the U.S. sector despite having smaller establishment sizes (ie. fewer employees in each establishment)?


If it’s the case that American construction firms, for whatever reason, have a greater ability/willingness to take advantage of economies of scale (an explanation for their larger establishment sizes), one might expect the U.S. construction sector to be more productive than Canada’s. Empirical evidence suggests otherwise. Canada’s construction sector, despite its smaller establishment sizes, is more productive, says several studies. It also has slightly more capital intensity, but this could mean a few things (ie. low economies of scale; high capital costs).
I have some ideas but I'll sit on this some more and come back to it in my next post.

Source of graphs: Don Drummond, TD economist (2005).

Wednesday, January 03, 2007

Canada's generous passport policy

Canadian policy-makers will soon be reviewing the subject of taxes on non-residents and citizenship options. Unlike in many countries, in Canada non-residents do not pay taxes, and yet they have the option to benefit from a number of social programs.

The CD Howe Institute recently published a paper by John Chant, a professor of economics at Simon Fraser University, titled The Passport Package. The passport package, says Chant, is the package of benefit options that non-residents receive. These include easy qualification to healthcare benefits, free entry and exit, resident tuition fees, financial assistance when enroled in postsecondary institutions, and more.
Chant suggests that all non-residents pay a flat passport renewal fee. He compares the "passport package" to financial options.

The theory of financial options provides guidance with respect to setting the level of the passport fee. The value to the holders of the passport package over any period equals the sum of the values of each option in the package. In turn, each option has a value equal to the probability it will be exercised in the period, times the value the holder gains from its exercise. Different holders of the passport package would attach different values to each element. A law abiding citizen who values avoiding a year in a foreign jail at $60,000 would be willing to pay $6 a year for the privilege of repatriation if they have a 1/100 percent chance of spending a year in a foreign jail. Someone more criminally inclined may be willing to pay much more.

Like financial options, the options in the passport package are exercised when they are "in the money"; that is, when the value of the object optioned exceeds the strike price at which the option can be exercised. In the same way, passport options are exercised only when their holders perceive that the benefits from exercising exceed the costs.

Often this will be dictated by events. The benefits from higher education become attractive when a student wants to come to Canada to study; the prisoner exchange becomes valuable to someone facing jail in a foreign land; and the option of evacuation and assured entry to Canada will be exercised in times of war and domestic upheaval. The parallel with financial options goes further: if people fail to renew their passport, the option expires out of the money. To make the package self-supporting, the fees would have to cover the cost of underwriting the exercise of the options. The revenues of the package would depend on the reaction of non-resident citizens. Some would judge that the value of the package exceeds the fee and opt to pay, while others would let their passports lapse and lose the benefits. If 20 percent of current non-resident citizens opted not to pay the fee, a $500 fee for five-year renewals would raise roughly $200 million per year.

This seems reasonable. If non-residents don’t find that the "passport package" is worthy of the price tag, they don’t need to renew their passport. It also seems simple. It’s far less complex than actually taxing non-residents.
Chant adds:

John F. Kennedy’s appeal, "ask not what your country can do for you — ask what you can do for your country" was a high mark for the rhetoric inspired by citizenship. Its message, however, is at odds with reality. People do weigh the benefits and costs of citizenship in deciding which and how many passports they carry. Some become and remain citizens of countries where they never intend to live.

Snickerdoodles and sea creatures

Tim Haab points to an interesting article:


Researchers at the University of Washington say all that holiday baking and eating has an environmental impact — Puget Sound is being flavored by cinnamon and vanilla.
[...]
So far, the research has turned up no evidence that snickerdoodles are harming sea creatures, but their research does lead to some serious environmental questions. Fish rely heavily on their sense of smell to locate food, for example, and, in the case of salmon, to find their way back to their home stream to spawn.

Tim’s environmental solution:


I propose a Christmas cookie cap and trade system. You are each hereby allocated one dozen cookie permits per month. These permits are fully bankable and tradeable and can be saved for the Christmas cookie season. I will monitor your consumption and be mandated to take any unpermitted cookies off your hands. I will dispose of them as I see fit.


I question Tim’s motives. Why stop at cookies? A true environmental martyr would be happy to monitor the giving of unwanted Christmas sweaters (see below) that are produced (and disposed of) every year.

Given that the textile industry uses toxic chemicals to bleach and dye yarn, perhaps the production of Christmas sweaters is worse for the environment than the vanilla and cinnamon inputs used in household kitchens. The tighter the cap on Christmas sweaters, the better, in my mind.

Wednesday, December 27, 2006


I'm off for an outdoor adventure here...

If you guessed that there will be no computers, you're right. But I'll be back and blogging again in four days or so.

Happy holidays and all that jazz!

Sunday, December 24, 2006

Traffic accidents and real economic activity

Health Economics has published a paper by Antonio García-ferrer, Aránzazu De Juan, and Pilar Poncela titled, "The relationship between road traffic accidents and real economic activity in Spain: Common cycles and health issues." The authors say that this study has implications for health policy.
Abstract:

This paper analyses the aggregate relationships between traffic accidents and real economic activity in Spain during the last 30 years. Our general approach is based on two basic assumptions: (1) the number of accidents depends on the use of cars and other exogenous variables, and (2) the level of economic activity affects variation in the stock of cars, as well as degree of utilization. We propose a novel turning point characterization for monthly seasonal data that allows to check whether economic and road accident cycles coincide and, to date the beginning and end of their respective cycles. Empirical results from this section are important in establishing posterior causal models and whether or not economic activity and road accidents have a common component in the long run and a varying lead-lag relationship, depending on the cycles. These models will be the basis to check when Spain will achieve the European Union figures in terms of the fatalities/accidents ratio under different scenarios. Empirical results as well as historical experiences from other European countries proved that reducing fatalities is not only a question of diminishing accidents rates.

Friday, December 22, 2006

American Pie

CIBC's Avery Shenfield was feeling a little artsy when he published the bank's latest weekly forecast. Here's an excerpt from his rendition of 'American Pie':

A long, long time ago…
I can still remember, how the data used to make us smile
And I knew that if they had the chance
That stores could make the shoppers dance
And, maybe, they’d be happy for a while.

But housing prices made them shiver
With no more tax cuts to deliver
Bad news on the wealth front
It couldn’t be much more blunt
I can’t remember if I tried
To have my VISA charred and fried
But something hit me deep inside
The day, the house boom died.

So buy, buy, the consumer won’t buy
Leaving Chevys at the levee
And Ford sales running dry
And Wall Street boys were drinking Perrier and rye

Singing this will be the day that I die
This will be the day that I die.


More of that here (pdf).

Wednesday, December 20, 2006

Tax evasion: lessons from Egypt

In my view, we should be taking a lesson from Egypt when it comes to dealing with tax evasion. I'll explain.

Studies claim that tax evasion among the self employed in Canada is common and the costs are high. What should be done? First, it depends if the government is concerned purely with inefficiency, or if its concern is inequality (which do not need to be trade-offs, as I've argued before here; and I'll point to my view on equality here). I'm going to address the aim of efficiency here, but I'll quickly explain why.

In a welfare state, the objective of an inequality-averse government would be to raise taxes to redistribute incomes, and thus auditing would be useful to protect the tax base. But there are drawbacks to making equality the only major priority. I won't get into the old equality debate again here, but here are a few thoughts: First, when are degrees of inequality aversion sufficient? And, how do we know if such a degree is attainable? Finally, it's worth repeating that, if efficiency is gained, equality does not need to be a trade-off.
My assumption henceforth is that efficiency is the government's concern when it comes to deterring tax evasion.
What actions can the government undertake to increase efficiency? Three possibilities: Do nothing, design an efficient auditing scheme, or cut taxes to a point where the self employed are more willing to pay (and, ultimately, adopt a low flat tax).
Do nothing
If efficiency is the major concern, nothing should be done, claims Simon C. Parker in The Economics of Self Employment and Entrepreneurship (2004: p. 248). Audits are expensive for the government and for the individuals who prepare the tax reports for audits. [edit: My hurried fingers pasted the wrong quote here. Sorry. Intended quote:] "These costs impose deadweight losses on the economy." Parker concludes that a government would be more efficient to not audit.
Design an efficient auditing scheme
Herb J. Schuetze (2002) disagrees. He finds that (at least in Canada) a discriminatory method of auditing would be most effective in reducing tax evasion.
Excerpt from Schuetze's paper "Profiles of Noncompliance Among the Self Employed" (2002, p 19-20) (The entire paper can be found here. Click on "research"):

Even though pre-tax wages will adjust to equalize after-tax wages, too many resources, in terms of efficiency, will be allocated to occupations which provide the greatest opportunities for noncompliance. This result also suggests an obvious strategy for the development of an effective tax audit system. One which targets the self-employed in construction and service occupations is likely to be more effective.

...A tax audit scheme targeting groups which have been found to conceal income the most (such as self employed households headed by younger males or those in the construction and service occupations) is likely to be an effective tool in reducing noncompliance.


He acknowledges a disadvantage:

Clearly, such a policy, if continued for a period of time, would lead to the misrepresentation of occupation and other characteristics by self-employed tax filers to avoid being audited. However, if the information from these audits is used effectively, policies can be designed to reduce noncompliance.


Such a well-designed auditing scheme might be attractive, but perhaps its major disadvantage (other than the one pointed out by Schuetze) is that it's not simplistic. Simplicity in self-employed tax treatment, or any tax treatment for that matter, should be an objective within any economy. By the way, The World Bank agrees with this sentiment (link via The Heritage Foundation) :

Complicated tax systems can lead to high evasion, even when rates are low. ... A better way to meet revenue targets is to encourage tax compliance by keeping rates moderate.

Lower taxes
In my mind, the best solution would be to take a lesson from Egypt. That is, lower taxes to a point where the self employed are willing to pay (zero would be the ultimate). By extension, if taxes for the self employed are to be lower, taxes for all business should be lower. A flat tax seems to be the most efficient, but I digress. Let's get back to Egypt.
Excerpt from "TAX: Abrupt halt to haggling." The Financial Times, Dec. 11:

"The existing culture as far as the tax authority was concerned was a story of predation." says Youssef Boutros Ghali, the finance minister. "Anything the tax authority could squeeze out, it did. But now we have affected a fundamental change of attitude. We have given up predation and established a partnership through a law that is transparent rather than fuzzy and through reducing the tax rate to what people would be willing to part with."

The new law set the top rate at 20 per cent for both individuals and companies, down from 42 per cent. It offered a total amnesty to those who had never filed a return in their lives, regardless of how long they had been earning, if they presented themselves before the end of March 2006.

The law also introduced self-assessment, changing at one fell swoop a system based on the assumption that the tax payer is always a liar, to one in which inspectors have to believe properly-maintained records presented to them, unless they can come up with evidence of wrongdoing.

At the same time penalties for tax evasion have been seriously stiffened. Mr Boutros Ghali says the impact in the first year has been dramatic, with 2.6m returns filed, up from 1.7m in 2005.

The finance ministry had been expecting receipts to drop by 12 per cent in the first year and by 7 per cent in the second before climbing back to their original level at the time the legislation was introduced. Instead, tax receipts have grown by 17 per cent - a reflection of both the wider tax base, and the buoyant economy.

....It is still not uncommon for middle class professionals to argue privately that they should not pay tax, citing examples of official corruption or waste, or to justify tax
evasion by saying that they make no use of the subsidized and generally bad health and education services provided by the government and that, instead, they pay exorbitant fees at private schools and hospitals.

Tax inspectors also say that under-reporting is still rife. One cited the example of a doctor who charged him personally $20 when he went for a consultation, but when he filed his return he listed his fee as less than $4.

No one has any doubts that it will take years for a new tax culture to take roots. But there is agreement that new law is definitely a start.

Now Mr Boutros Ghali says that, with an improved computerised system, and freed of the necessity to check the records of every single taxpayer, his 39,000 inspectors will have more time to chase evaders.

Perhaps we could do better to take our complex tax systems to the trash and keep an eye on Egypt.

Tuesday, December 19, 2006

Income Splitting Among the Self-Employed

Which system of taxation on the self employed evokes the greatest tax distortions?

I) An income-splitting system where individuals may appeal to tax non-compliance; or,

II) A system of individual taxation where individuals may simply not report income.

In an interesting paper forthcoming in The Canadian Journal of Economics, University of Victoria professor Herbert J. Schuetze estimates (with a few caveats) that in Canada’s income-splitting system “…approximately one half of a billion dollars in taxes were avoided in 1998 by more than 90,000 businesses.”

An abstract from “Income Splitting Among the Self-Employed:”

Whether the individual or the household should be the unit of taxation is a long-running debate in the economics literature. One potentially important cost associated with a switch to individual taxation, which has been overlooked in this debate, is the impact of such a move on tax non-compliance. In particular, under individual taxation with progressive marginal tax rates households in which the distribution of income among household members is unequal benefit from attributing income from the higher to thelower income household member. The absence of a third party reporting income enables self-employed households to "split" income among family members to reduce income tax liabilities. Using the Canadian experience as a case study this paper sheds light on the magnitude and nature of this activity by developing a unique estimator of the incidence of illegal income splitting among couples. These estimates provide evidence that the occurrence of income splitting is likely non-trivial and suggest that the costs associated with this activity are potentially significant.


Schuetze draws a comparison between the U.S. and Canada. “The current US tax code, which primarily treats the household as the unit of observation, is such that the distribution of income within the household does not affect household tax liabilities.”

His findings:

…the raw reported employment rates of wives of self-employed men in Canada are significantly higher than those of their US counterparts. …. No significant difference in employment rates are observed among husbands…. I find strong supporting evidence that the employment differential found among wives is indicative of Canadian self-employed men attributing income to their wives.


He concludes:
…the pattern of income splitting found above suggest that countries that have high marginal tax rates, unequal wages across men and women and high rates of self-employment may find a system of joint taxation optimal, while for those with low incentives for income splitting individual taxation may be more appropriate.

Perhaps as equally interesting as his findings (at least to me) is the methodology he uses. He attempts to identify hidden behaviours, taking a lesson from Duggan and Levitt (corruption in wrestling) and Jacob and Levitt (cheating among teachers), among others.

Monday, December 18, 2006

Santas and elves: skilled and unskilled?

Apparently the demand for skilled Santas in Alberta vastly exceeds supply. The problem, says Victor Nevada, headmaster of a Calgary-based Santa School, is that Santas are being paid as though they were unskilled workers. Gasp!

Malls should classify the Santa position as skilled labour, he said, given the job requires skills ranging from acting to psychology.

"Santas encounter stories that cause a lot of emotional distress for Santa and children generally are regarding Santa at that point as psychologist, I suppose," he said. "They're looking to Santa to provide some closure, some comfort and so forth and that's why I say it's a skilled position. If a personal shopper can make $50 an hour I would think that a skilled Santa should also make at least about $50 an hour."


I'm sure it's gruelling, but there must be plenty of elves willing to do the job for less than $50.

That would answer the problem from the supply side, but what about demand? No problem. If malls were to treat elves as subsitutes to Santa rather than complements, perhaps supply will create its own demand, as Says Law goes. After all, elves are small (less intimidating) and often more agile (exciting). They can sell themselves.

Perhaps any one of these small people pictured below would have prefered an elf if only the market existed.


If demand is as low as anecdotal evidence suggests, there's no reason for wages to be as high as $50/hour, and thus Alberta's Santas are right to go work on the oil rigs.
Plenty of anecdotal evidence of weak demand sweeping across North America can be found here.

Saturday, December 16, 2006

Link fest

I've made a few discoveries.

1.Bill Goeff's Econ Search Engine (Google Trial III) is a customized search engine that "lets you use Google to search the contents of some 10,000 economics web sites (the URLs are from RFE and EDIRC)." The best part is that you can add his search engine directly to your Google homepage.
How useful is it? Very. For example, if you search for the word "toilet" using Google, you'll find The Home of Toilet Art, Humor, and Fun Facts. But use Bill's Econ Search Engine and you'll be led to worldwide portable toilet sales. Voila. No more humour, fun, and all that crap. Thanks Bill! Log into your Google account, click on Google Gadgets For Your Webpage, and run a search for "Econ Search Engine Google Trial III."


2. I'm really digging the Vancouver Housing blog. Don't let the name fool you. There's a lot to learn here. For example, here, he/she asks if immigration is driving the Vancouver housing boom. And here he/she looks at median family incomes in cities across Canada. And if you need more convincing, it won best Canadian business blog this year. Unfortunately, the author is on a holiday hiatus, but the archives are worth reading for now.


3. I often wish that Canada would catch up to the U.S. and the U.K. when it comes to the frequency in which (some) data is collected, as well as the accessibility of (some) data.

But now we have Swivel available to us, which could possibly, maybe, perhaps improve the data accessibility problem as long as people use it, and use it well. Tech Crunch has an explanation (h/t Statistical Modeling, Causal Inference, and Social Science).

Friday, December 15, 2006

Sources of inequality

Recently we saw the release of two interesting reports on household wealth: the Canadian household wealth figures for 2005 from Statistics Canada, and a report from the UN University's World Institute for Development and Economics (WIDE).

The WIDE release and the StatsCan release cover a lot of ground. Incidentally, the StatsCan release is the first of is kind to offer such detailed data on Canada's household wealth distribution since their last such release in 1995 (we're a bit behind the U.S. and the U.K. in the frequency in which we collect this particular type of data). An attempt is made to actually isolate the sources of inequality, which makes for a unique (as far as I know) opportunity for cross country comparisons of sources of inequality.

What can we learn about the sources of inequality of wealth in Canada?

One thing we know is that the middle class holds the majority of their wealth in the form of their principal residence .
Graph via TD
For comparison:

Graph source: WIDE

Secondly, the richest Canadians are likely to hold a greater portion of their wealth in stocks, relative to lower classes.

TD economists Don Drummond and David Tulk offer their analysis on this:

A distinguishing feature of the 1999 and 2005 wealth surveys is the decline in the real value of stock holdings. As the wealthy hold a disproportionate amount of stocks, the decline in the real value is the principal reason why the concentration of wealth in the highest quintile did not increase by more. If investment returns rise the trend towards growing wealth disparities will likely intensify. This could be compounded by sluggish wage gains in the low end and the financial challenge of immigrants – the main source of growth in the younger, less affluent population.


The National Post says tomato differently:

Net wealth -- non-financial and financial assets minus liabilities -- jumped to 640% of annual disposable income in 2005 from 527% in 2000 and just 370% in 1995, when the country was struggling to emerge from a recession.
The surge in wealth in 2005 reflects rising stock markets and once again the positive terms of trade shock where a stronger dollar is making imports cheaper while export prices surge.
That appears to more than offset total debt of 126% of disposable income in 2005.

The point is, the source of household wealth differs across classes in Canada.

I have two thoughts on this. First, equality varies across time and space. Placing countries on an ordinal scale seems bizarre (to me, anyway), likewise to drawing conclusions based on "trends." The richest Canadians hold a high portion their wealth in stocks, which vary in their returns across time, therefore "equality" is not a stationary measure. Further, there's of course often heterogenity in the data across regions. Perhaps one of the key benefits of these studies is that they allow us to examine the nature of sources of wealth, rather than pointing us to "trends," or forcing cross-sectional data into ordinal scales where both are inappropriate beyond very general terms.

Second, there are policy implications. By understanding the sources of inequality we can fight the impulse to redistribute wealth based on "trends." Further, it should be perfectly clear to policy makers that the needs of investors should be accommodated (since we know where household wealth is concentrated). Onay oremay orporatecay axestay. Right? Clear.

There's so much to explore on this subject, but I'll quickly note one of the many interesting aspects of equality: tax shifting, which neither study had anything to say about, unfortunately (but perhaps understandably so in the Canadian context). Alan Reynolds from yesterday's WSJ (h/t Greg Mankiw):

As was well-documented years ago by economists Roger Gordon and Joel Slemrod, a great deal of the apparent increase in reported high incomes has been due to "tax shifting." That is, lower individual tax rates induced thousands of businesses to shift from filing under the corporate tax system to filing under the individual tax system, often as limited liability companies or Subchapter S corporations.

As far as I can tell, this doesn't seem like a big problem in Canada. Jack Mintz and Michael Smart (2001):

Canada integrates corporate and personal taxes by providing a dividend tax credit and excluding a portion of capital gains from taxation. At the small business level, the combined corporate and personal tax rate on equity income is roughly equal to the personal rate on employment and interest income, while for large companies combined tax rates on equity income exceed that of other income. When the small corporate tax rate has been changed in the past, governments have typically adjusted dividend and capital gains tax rates to maintain integration at the small-business level, in order to minimize incentives for shifting between corporate and personal tax bases.

The subject of "equality" often makes me want to rip my hair out, but there are surely thousands of useful, interesting ways to look at it, as StatsCan and WIDE have proven. What a thick and intriguing subject. Please, let's stop dissing it.

Thursday, December 14, 2006

Defaults and donations

It's been a news-heavy week on the personal front, but I'm attempting to get back into some kind of routine, which would include catching up with my reading (a futile task) and blogging more regularly.

Here's just a small thought I've been pondering: How can we encourage individuals to commit to donating, including the donation of their money to charity, or the donation of their organs when they die? Maybe we shouldn't. (edit: At least not on an individual level).

First, consider organ donation.

The Edmonton Journal reports, “Health Canada has identified a shortage of organ donors in Canada, noting Canada has one of the lowest rates of organ donation in the industrialized world.”

Consider the ways we can encourage organ donation.

The government can commit to ad campaigns to attract the so-called "altruistic donor." It could also offer a tax deduction of, say, $5,000 or $10,000 off the estate of an organ donator.

The first option can be costly and ineffective. And, a tax deduction? Well, I happen to think that there shouldn't be an estate tax, so I'm not quite on par with this solution either.

Then there are financial incentives beyond tax deduction. Alex Tabarrok explains (2004):

In the minds of many, financial incentives for organ donation means rich people buying up kidneys being hawked on eBay by the desperately poor...Two distinctions are especially important. First, financial compensation for cadaveric donation and for living donation are different ideas and it is quite possible to have one without the other. Indeed, the primary cause of so-called organ tourism—rich people flying to poor countries like India to undergo a transplant from a poor, living donor—is the shortage of organs in the West. By allowing compensation for cadaveric donations we’ll increase the domestic supply and reduce the demand for people to fly to poorer countries for living donation. Financial compensation for cadaveric donation, in other words, is a substitute for both paid and unpaid living donation.


Second, organs are currently allocated according to a point system which is based on factors such as the quality of the match between donor and recipient, the length of time the potential recipient has been on the waiting list, the health of the potential recipient and so forth. It is not necessary to change these criteria in order to make use of financial compensation. Financial incentives can be used to increase the supply of organs without using finance to determine who will receive an organ.


The solution that has my attention is this: change the default. Andrew from “Statistical Modeling, Causal Inference, and Social Science” explains:

Over 99% of Austrians and only 12% of Gernans consent to donate their organs after death. Are Austrians so much nicer than Germans? Maybe so, but a clue is that Austria has a "presumed consent" rule (the default is to donate) and Germany has an "explicit consent" rule (the default is to not donate). Johnson and Goldstein find huge effects of the default in organ donations, and others have found such default effects elsewhere.


What does this have to do with financial charity donations? Andrew goes on:

Lots of research shows that people are likely to take the default option (see here and here for some thoughts on the topic). The clearest examples are pension plans and organ donations, both of which show lots of variation and also show people's decisions strongly tracking the default options.

....My hypothesis, then, is that the groups that give more to charity, and that give more blood, have defaults that more strongly favor this giving. Such defaults are generally implicit (excepting situations such as religions that require tithing), but to the extent that the U.S. has different "subcultures," they could be real. We actually might be able to learn more about this with our new GSS questions, where we ask people how many Democrats and Republicans they know (in addition to asking their own political preferences).

Does this explanation add anything, or am I just pushing things back from "why to people vary in how much they give" to "why is there variation in defaults"? I think something is gained, actually, partly because, to the extent the default story is true, one could perhaps increase giving by working on the defaults, rather than trying directly to make people nicer. Just as, for organ donation, it would probably be more effective to change the default rather than to try to convince people individually, based on current defaults.

I'm not quite sure how changing a default would work with regards to giving money to charity, or giving blood, without infringing on people's freedoms (I don't consider Austria's "presumed consent" rule to be such an infringment), but I like how Andrew is thinking and I'll be pondering his idea more.

Sunday, December 10, 2006

The Art of Controversy, Verizon style

Prof Greg Mankiw points to a recording that “takes a while, and it is not at all edifying.” Go ahead and laugh at the math skills held by a couple of Verizon call center employees, but notice the skill they present on other fronts. Namely, they are natural masters of controversy.

Unable (or unwilling) to see their mathematical error, they've wisely armed themselves with Stratagem XXII, Stratagem XV, and Stratagem XXXVI from Arthur Schopenhauer's Art of Controversy. That is, “Petitio principii,” “Use Seemingly Absurd Propositions,” and (the powerhouse) “Bewilder Your Opponent by Mere Bombast.” Their strategies are classic, and painful to listen to (their greatest strength perhaps). Real slick.

George, their opponent, was left with few options. He thus pulled out Stratagem XXVIII: “Persuade the Audience, Not The Opponent.” Brilliant counter attack. The public release of his phone conversation has surely left the blogosphere entirely persuaded (and amused).

A couple more days of hibernation and I'll be back (with less fluff).

Sunday, December 03, 2006


To anyone who still returns this blog, I really appreciate you being so patient with my increasingly relaxed blogging habits. I'd prefer to be posting more often and I have a few ideas that I'm eager to run past anyone who will listen. The frequency will pick up here again in a week when I return to trying to earn your love (or at least your readership).
Sometimes I think Stanislaw Lec wasn't being so terribly peculiar when he said, "People find life entirely too time-consuming."

Saturday, December 02, 2006

Economic growth or flat labour productivity?


I don't see sunshine and lollipops going into Q4, but November's labour figures make me slightly less bearish than Marc Lee. The fact is, hours worked increased by 1.6% since the end of the last quarter and labour growth still looks healthy (even though much of the net growth in employment was in lower-paying, part-time positions, unlike what we saw from October's net gain in employment of 51,000). Further, as we know, people with jobs spend money.

When October's employment figures came out, I asked why job growth is so out of sync with GDP growth. This still puzzles me, but I'm comforted to know that I'm in good company. TD Economist David Tulk asks a good question:

With just a single month yet to be revealed, 2006 is shaping up to deliver the labour market’s best performance in three years with the expected addition of near 300,000 net new jobs. This stands in contrast to yesterday’s GDP report which shows that economic growth has slowed markedly over the middle quarters of 2006. However, an encouraging development for the final quarter is the pick up in hours worked. Over the first two months of Q4, hours worked have increased by 1.6%, reversing the 0.1% fall observed in Q3. The puzzle is to sort out whether this indicates more economic growth momentum though the fourth quarter of 2006 than suggested by the 0.3% decline in September’s real GDP or a flattening of labour productivity.
Really, the increase in hours worked shouldn't be too surprising, nor should the fact that it hit the right regions in just the right sectors. In October we saw full-time employment rise by 50, 500, putting labour-starved Alberta out of its misery. Well, not quite -– demand is still there -- but Alberta and British Columbia did gain 70 per cent of those new jobs, and November's employment figures tell us that Alberta's woes continue to improve.

Perhaps a productive workforce throughout Q3 and Q4 will be enough to partly offset the economy's bleaker qualities (eg. our less than pretty exports choking on the strong dollar -- which has since improved), and give us less to be bleak about after we witnessed a Q3 GDP growth rate of 1.7%.

In fact, never mind the labour report, maybe the Q3 GDP figure isn't so bad on its own.
Tulk again:

...the details are not as discouraging as the headline number would suggest. While some of the weakness can be traced to the second consecutive quarterly decline in residential investment, the main cause of the deceleration in real GDP growth was a combination of more moderate government spending and falling inventory investment – two of the more volatile components of real GDP. For example, part of the deceleration in government spending from 4.9% in the second quarter to 0.7% in the third was due in part to the one-off effect of the conclusion of the 2006 Census. Meanwhile, the fall in inventory investment likely reflects some unwinding from the significant accumulation in the previous quarter.

As long as firms refuse to fire workers until a recession is in sight, labour growth is a poor indicator of things to come; however, in sum, here's my guesstimate: A slowdown is inevitable, but Q4 has a cushion of labour productivity that some aren't seeing.

Random notes

1.'The latest jobless rates and what's behind them.'
CBC has updated its nifty interactive tool to reflect November's employment figures.
The west wins again.
2. I'm burning to relieve myself of this. Why does at least one Canadian journalist insist on mirroring U.S. journalists by over-emphasizing the housing market figures when housing is such a smaller influence on Canada's CPI? I'm going by memory, but I believe that housing has a weight of 3.5% in Canada and 30% in the U.S.

Wednesday, November 29, 2006

Mary (Foley) Doyle, dead at 88

I thought I would try something new on this blog. After realizing how very few female role models I have, I became convinced that it's only because I'm unaware of the many successful women out there. In an effort to learn more about them, I'll be profiling female economists and business women, maybe once or twice a month, beginning today with Mary (Foley) Doyle.

My group of friends are some of the most magnificent people in the world (I just know it), but when I came across the obituary of Mary (Foley) Doyle, I wished I could have added her to my circle of friends. I want to share this piece, written by her children, which ran in The Globe and Mail last week. She seems like a spectacular woman (a chairwoman in 1956!), and this glimpse into her life is truly inspiring.

Mary (Foley) Doyle
Mother, businesswoman. Born July 5, 1917 in Point Mall, Placentia Bay, Nfld. Died May 23 in St. John's, of heart failure, aged 88. Mary Foley was raised in Corner Brook, far from her parents' native Placentia Bay. Work had lured them west. Her mother was a determined redhead whose genius was to feed and clothe seven daughters and a son on a mill-worker's wage.
Mary graduated from St. Henry's, narrowly missed a university scholarship, and took “commercial.” She soon became a private secretary. One day, offered the rare opportunity to make a long-distance call, she phoned a Water Street merchant in St. John's, replying to an ad. Impressed, he hired her.
Three years later, Mary married Gerald Doyle. He was a widower, 25 years older than she, and living on an eight-acre estate. She stepped into a household with maids, a cook and a gardener — and five young motherless boys. Dinner parties, New York business trips, cruises and summers sailing around Newfoundland: She'd been swept into a world of glamour, travel, and love. When he died in 1956, he left a bewildered 39-year-old with three more small children in the mix. She was thrown immediately into a man's world as “chairman” of her husband's manufacturer's agency, in charge of 50 employees.
Mary Doyle never felt at home with St. John's “society.” She sought company, and found it in the Redemptorist priests: intelligent, urbane men who posed no threat to her widowhood. The mother of our childhood was stunning, decisive, and slightly scary. She wore a sealskin jacket, drove a Land Rover and had two German Shepherds. If a man hesitated when approaching her, she'd exclaim: A man who's afraid of dogs! She was fearless, bought and sold property without advice, and travelled without reservations, including a three-month European tour with kids. Later, she drove around Morocco in an Austin Mini. Fearless, yet. . . she once opened the front door, and ordered a passing teenager to come in and catch a mouse. At 53, her family raised, Mary walked into a classroom of 17-year-olds and began university. She took notes in shorthand, asked smart questions, and wrote A papers. At 57, she crossed the stage to collect a history degree. The photo records a proud and defiant woman.
Mary was anti-Confederate. Returning Canadian? she'd be asked at a border. I carry a Canadian passport. Canadian citizen? I was born in Point Mall. Eventually, a frustrated guard would let her pass. Her rage against Canada dates from 1939 when an immigration officer on a Halifax dock looked down at her seven-year-old Down Syndrome sister. He removed the child to a holding cell and next day handed her back: Entry Denied.
Mary was a fighter. Stacks of yellow paper document responses to injustice. In 1969 she fumed in a church pew on Fogo Island while a priest “harangued his own good people.” She wrote him about what he had “flung with vituperation” to “a captive audience who could not speak back.” She copied the bishop.
Her independence strengthened as she aged. At 77 she was tough enough to cope with the blow of losing a leg. For months her car sat idle in the driveway; she couldn't relinquish this symbol of mobility. In time, she installed a lift which she rode to a waiting wheelchair downstairs. She'd open the garage door remotely and take a cab to the bank. She and her dog carried on through the Newfoundland winters for five years. She moved in briefly with her youngest son then, with courage and insight, made the inevitable move to a home.
She was a rebel, and fires of defiance continued to burn even as her world grew smaller. She hung a bold sign on the door: No admittance after 11:00 p.m.

John, Bill and Marjorie are Mary's children.

Tuesday, November 28, 2006

The BoC's big obstacle

The Canadian press is giving a lot of ink to the possibility of the Bank of Canada setting a lower inflation rate in the future and, further, the possibility that it may favour price targeting. Of course, no action would happen until 2011 if it happened at all, but with the next renewal due this December, the subject is a popular one.
If the public doesn't "get it" though, is price targeting worth pursuing? From The Toronto Star:
Inflation target under review (Nov.27)
[UWO prof David Laidler] acknowledged it would be “risky” to change the rules without careful preparation of the public, but proposed a one per cent target, stressing that “a two per cent inflation rate is a far cry from anyone’s (or at least any retiree’s) idea of price-level stability.”
The Bank of Canada raises another, more complex, possibility: targeting a price level. This would mean that periods of above-target inflation — which under the current policy are written off while the bank seeks merely to return to the two per cent level — would have to be offset by periods of inflation below the target to produce stable long-term prices. The bank’s document acknowledges “the difficulty that might be associated with explaining price-level targeting to the general public.”
Officials intend to complete their research “well before 2011 so as to ensure sufficient time for open discussion of the results and their implications.”

I'm beginning to think that one of the biggest obstacles associated with price targeting is the public's confusion over what it actually is and how it would work. Ben Bernanke and Allan S. Blinder could probably write a book or two on this subject by now after Bernanke proposed “the explicit numerical definition for the price stability objective” (I've blogged about the confusion they've both seen here). Bernanke's proposal is something like inflation targeting; still, I think his experience with proposing a new regime, as I wrote about in the link above, says a lot.

Monday, November 27, 2006

I'm short on time, but I thought I would share a few links that I find interesting.

1. Are husbands like potatoes? Bryan Caplan provides some food for thought in his latest post over at EconLog. His reasoning isn't compatible with my own, but it's laugh-out-loud funny. According to him,

"Once women can become financially independent of a man, they will choose to do so." This is theoretically possible, but only if husbands, like potatoes, are inferior goods.

He concludes that demand for husbands is at an all-time high.
A commentator points to a common survey outcome: “married men are the happiest people, followed by unmarried women, then married women, and the least happy people are unmarried men.” I don't know if I'd conclude that men are “inferior goods,” but they do seem to be heading that way. And yet, I can't manage to type this without laughing. Sorry, guys.
2. How do dietary norms affect the economy? I was somewhat surprised when I stumbled across a recently-published USDA report about the American national dietary guide. It explores what the impact would be on the U.S. agriculture sector if Americans changed their dietary habits to meet the dietary requirements suggested in the 2005 guide . Here's an excerpt:
For Americans to meet the fruit, vegetable, and whole-grain recommendations, domestic crop acreage would need to increase by an estimated 7.4 million harvested acres, or 1.7 percent of total U.S. cropland in 2002. To meet the dairy guidelines, consumption of milk and milk products would have to increase by 66 percent; an increase of that magnitude would likely require an increase in the number of dairy cows as well as increased feed grains and, possibly, increased acreage devoted to dairy production.

Saturday, November 25, 2006

The way you do I.T.

Does the degree of success enjoyed by US firms operating in the UK imply that productivity growth may have more to do with superior management/organization rather than simply geographical or regulatory environment? H/t to D.R. for sending this along.

Excerpt from, It ain’t what you do it’s the way you do I.T. (2005), by Nick Bloom, Raffaella Sadun and John Van Reenen; London School of Economics:

Productivity growth in sectors that intensively use information and communication technologies (ICT) appears to have accelerated faster in the US than in Europe since 1995. If this was partly due to the superior management/organization of US firms (rather than simply the US geographical or regulatory environment) we would expect to see a stronger association of productivity with IT for US multinationals located Europe than for other firms. We examine a large panel of UK establishments from all business sectors and provide evidence that US owned establishments have a significantly higher productivity of IT capital than either non-US multinationals or domestically owned establishments. Indeed, the differential impact of IT appears to fully account for almost all the difference in total factor productivity between US-owned and all other establishments. Further, this finding is particularly strong in the sectors that intensively use information technologies: the very same ones that account for the US-European productivity growth differential since the mid 1990s.

Addendum

How comparable is Canada to the UK when it comes to the productivity levels of IT? A recent article from The Financial Times sheds some light on this. The article suggests that the bursting of the dot com bubble may worsen things for both countries.

'Perfect storm' could stifle IT (Nov.22)

In the UK, a report by Lancaster University School of Management and the British Computer Society revealed that applications for computer science degree courses have dropped by half in the past five years. Software engineering applications have fallen by 60 per cent.

In Canada, things are not much better, according to the council organised by the government to monitor and promote the development of IT skills. Canada will need 89,000 new IT professionals in the next three to five years, warns the Information and Communications Technology Council, "yet enrolments in IT courses have dropped by 50-70 per cent because of the negative view of the IT sector," explains Paul Swinwood, president of the ICTC.
****
In Canada, the ICTC is also co-opting private sector organisations and community colleges as close to the client base as possible. "We're bringing together the engineers, the technicians and the technologists; my council, the Canadian Information Processing Society, and your local IT associations," says the ICTC's Mr Swinwood. "We can have a national programme but we need feet on the ground, in the community." Creating a link between high-level policy and direct action is crucial if IT education is to be effective in schools. The difficulties the sector faces in terms of generating appropriate skills are inseparable from its own success.

For many teachers who advise young people, it moves too quickly and unpredictably for comfort. This is why the BCS's Mr Rodd has been horrified to see some teachers advising students against careers in IT, citing the uncertainty caused by the bursting of the dotcom bubble.