The nation's state
Here’s a fun map from Carl Størmer that compares the GDP of U.S. states to other nations.
(Click for a larger view)
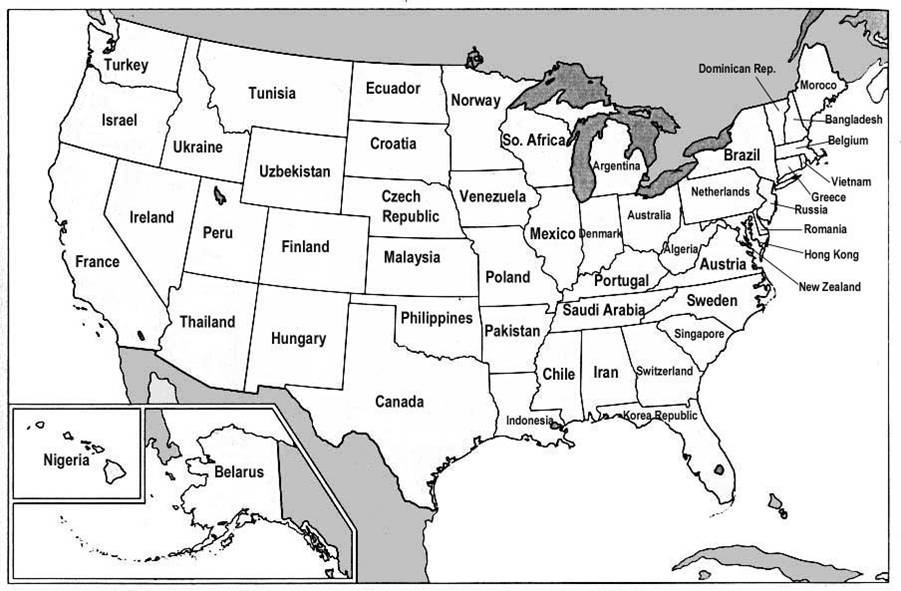
From what I can tell, it seems like it might be somewhat accurate in terms of ballpark figures. For example, Canada’s 2005 GDP was USD1131.8 billion while Texas’ was USD989.4 billion. What's a couple billion?
Anyway it’s interesting to consider.

7 comments:
I saw this before somewhere. A lot of the comparisons are quite close, others are as far apart as 50%. But when you put together a 1-50 list of other countries, it quickly becomes apparent that sometimes there isn't a good enough choice, especially when you consider that several US states might have about the same GDP.
My first thought on seeing this map though was that I wished it was GDP per capita. My second thought though was that many US states would remain empty, especially the richer ones, since there aren't enough rich countries in the world, and even some of the richer ones don't do much better than poorer states like Alabama.
On a side note, this also brings to mind my wish for a Gross State Product PPP. I've seen it before in nominal GSP, but not adjusted for purchasing power. Many of the states that seem to be the richest fall down the ladder under this comparison in my opinion with living costs in most of the Sun Belt much lower than in the Northeast and California for example.
And that thought brings up another wish of mine. Namely, what effect does adjusted GSP PPP have on overall US GDP when adjusted for PPP? (Seems absurd to have a $ adjusted US GDP figure, but when one considers that the EU is always divided up by regions, a.k.a. countries, why not the US too?). Also, the Sunbelt has seen larger population gains than the states with higher nominal incomes over the past two or three decades. This would thus seem to understate US GDP growth during this time period, and also understate personal incomes for the US as a whole for each decile. Although at some point, perhaps the top 1%(?), cost of living ceases to as much affected by PPP calculations. The higher the ticket price of an item, the lower a percentage of high local overhead there is in each item, and by extension in each basket of "rich" goods.
This finally brings up another possibility, namely that US income inequality might not be as high as it seems, especially if one leaves out the top 1%. A resident of Manhattan who makes $50,000 a year is defintely poorer than a resident of Texas who makes $40,000 a year for example. If the US is seeing a population shift large enough to areas where PPP increases their real incomes, then inequality might conceivably be falling, again discounting the much discussed top 1%.
Putting the top 1% back in again leaves the top 1 vs the bottom 99 ratio roughly intact for back of envelope purposes. In other words, still quite large.
To clarify what I meant about reduced inequality excepting the top 1%, imagine the distribution curve of US incomes. Now imagine, excepting the right 1%, that the left side of the curve moves to the right due to PPP calculations (the states with lower incomes also almost always tend to have lower costs of living), while the right side of the curve moves to the left due to the high cost of living under PPP terms.
Thus, 99% of the distribution curve (or 98% or whatever) is much more compact, leaving only the right 1% (or thereabouts) as an outlier.
That’s a lot of wishes! :) I saw this map on another blog first, but I can’t remember who to hat-tip. oops. I’m usually pretty good at giving mention.
I think GSP PPP would tell a lot about how income is distributed and perhaps add guidance on how investment and policy decisions are made.
If GSP PPP gives US GDP a great degree of bias when adjusted for PPP, then we might gain an idea of the demands in a region. The Vancouver Housing Blog recently had a post about school closures in Vancouver. Apparently the closures have been blamed on low funding and other things, but VHB claims that the housing boom simply makes the area unattractive to families. As PPP adjusts, so might the composition of demands, so supply should adjust. Of course, the upper x-tile would have to be accounted for, as suggested.
Anyway, nice idea.
I can’t help myself. If GSP PPP were to be measured in Canada (I guess that would make it “GPP”), an interesting index might be the “Double Double” index, referring to a Tim Horton’s double double coffee. Tim Horton’s establishments are practically municipal requirements in Canada (or so one may be led to think).
Perhaps a nod and smile would have been wiser than my last comments. Maybe the GSP PPP wouldn’t necessarily be a bright idea to guide policy and investment, in part because one would have to be careful to consider short-term booms and busts that are bounded by regions.
Regarding the coffee index, the same company probably barely adjusts its price of coffee across Canada, and the inputs into coffee don’t rely on a variety of a region’s resources (unlike how the Big Mac Burger in The Economist’s Big Mac index relies on a country’s beef, vegetables, labour etc). Actually, I think most quirky indices based on a single good would either be unsuitable or show insignificant price differences across states.
Still, GSP PPP could be helpful in understanding income distribution.
Statistics Canada has, on occasion, produced price indices which let you do comparisons across provinces - although it might just have been across major cities in provinces. They don't publish them all that often, though.
In the US, don't people use the numbers put out by the association of Chambers of Commerce for state cost of living comparisons?
Thanks for pointing that out. I wasn't aware that Statistics Canada does this.
Post a Comment